Knowledge Base

The capacity to learn is a gift; the ability to learn is a skill; the willingness to learn is a choice. - Brian Herbert, American Author

Spend Analysis - Overview

(A data driven process to identify cost saving opportunities)

There's a phrase, "you don't know what you don't know". Organization without Spend Analysis won't know what and where they are spending, which can ultimately leads to less visibility of real savings on overall and on category level. Availability of Spend Visibility & Analysis allows to make better decision making at all levels of the organization. A real data-driven Spend Analysis leverages more capabilities and effective savings opportunities at a lesser cost and in some cases, uncovering opportunities in just a few commodities can save millions of revenue. This shows the real power of spend analysis process.

What is Spend Analysis
  • Spend analysis is the process of collecting, cleansing, aggregating, classifying and analyzing spend data of an organization to understand about the spending trends and identifying saving opportunities, for the purpose of reducing costs, improving operational performance and ensuring compliance
  • Also leverage in other areas of business like contract management, complex sourcing, supplier management, budgeting, planning, and product development.
Benefits - At a glance

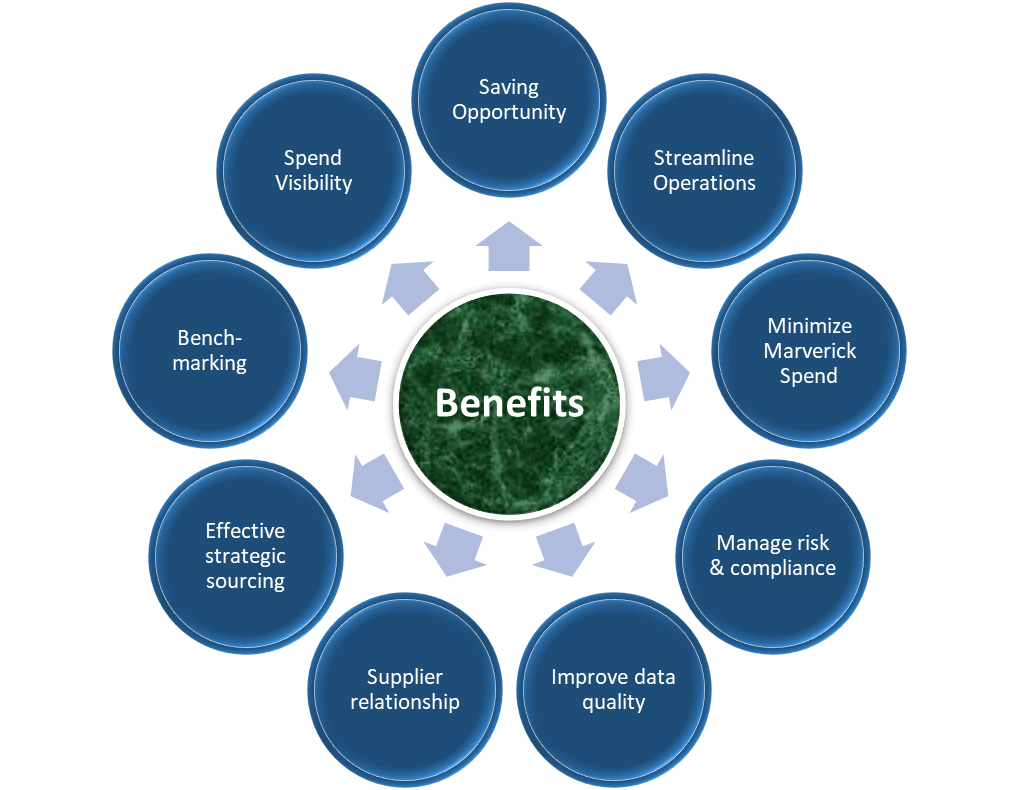
Spend analysis process leverage a number of effective benefits to procurement organizations like:

Spend analysis benefit
Challenges for Implementing Spend Analysis

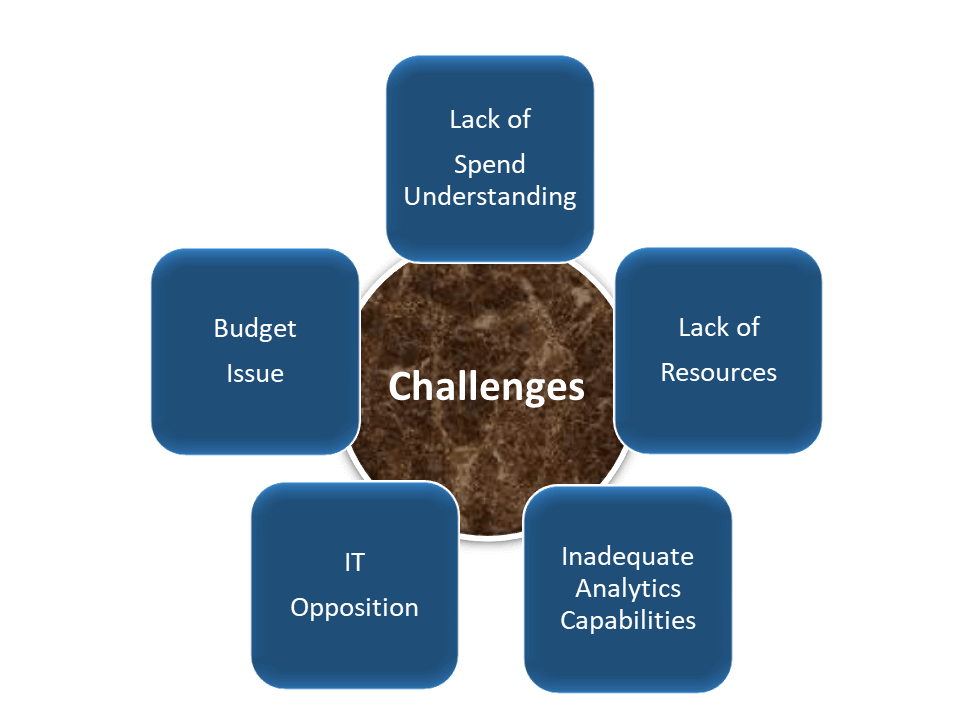
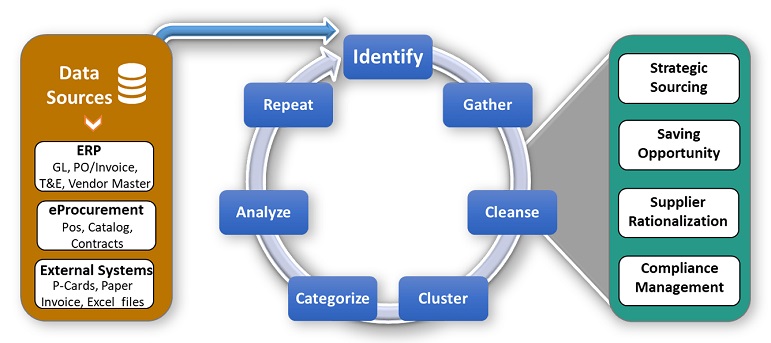
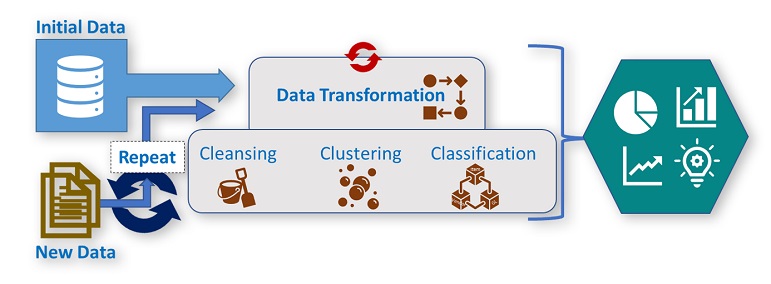
The current economic environment is forcing companies to prioritize and implement cost cutting programs faster than before. Useful data is increasingly "in the weeds" – as companies pick all the low hanging savings fruit. To achieve new results it becomes necessary to go below the data surface to look at the lowest level of the transaction, payment or related information. Other challenges include:

Spend analysis challenges
  • Lack of Spend Understanding
    • Spending data is often not up-to-date, incomplete or too high-level (e.g., not line item or part-level) to make the best decisions quickly and effectively
    • Many organizations are finding that they have overinvested in sourcing strategy development, purchasing automation, etc. but underinvested in the means to get at the data driving their decisions and actions
    • Companies have latched onto the "analytics" and "visibility" side of looking at spend and supplier data without first thinking through all of the implications about getting the right set of information in a usable format in the first place – they assume current providers are taking care of this initial step and gathering all of the appropriate information but in reality are sub-optimizing their programs and results
    • Some organizations are confusing data enrichment with cleansing and classification - enrichment can be a critical step following cleansing and classification, but enrichment alone will not lead to better data.
  • Lack of Resources
    • Traditional spend classification systems were designed to drive local opportunity identification and simple strategic sourcing programs – not programs on a global scale or those with any added degree of complexity (e.g., internal spend aggregation, buying groups, etc.)
    • Spend Analysis usually starts with Purchasing and Strategic Sourcing, who must request IT support or look within their own department for resources. Many times Purchasing is consumed with daily tasks such as buying basic materials for the organization. Although the need for IT support has lessened significantly, organizations still need to allocate resources to Spend Analysis and Strategic Sourcing to drive leverage across the organization.
  • Inadequate Analytics Capabilities
    • The 80% solution classification (i.e., 80-90% data accuracy) often leads companies to make incorrect strategy decisions rather than providing sufficient information needed to get the job done.
    • The more advanced organizations now look at expanding the scope and definition of spend visibility to include other data types (e.g., diversity, performance, risk). This data can add data fields that are incomplete, inaccurate and potentially misleading.
    • Frequently, global companies miss huge savings opportunities by not leveraging spend across their many operating companies worldwide. The decentralized data should be accumulated and classified based on a common data language. This common data language can be standard industry codes (such as UNSPSC) or custom commodity groups.
  • Budget Issue
    • The Finance team can be a key ally to sourcing and spend analysis initiatives. The Finance team can document progress and track any savings achieved from sourcing efforts. They also make sure that identified and implemented savings to the corporation are rolled-up and attributed to departmental budgets. This role ensures that savings are realized and brought back to the organization rather than saving money in one area then spending it on another area that is not in the budget. To save in one area yet spend these savings in another unplanned area does not benefit the organization. You achieved more but you didn't actually save more.
    • A Spend Analysis initiative helps measure the pattern of success. It makes it easier for Finance to measure and track ongoing success across the entire organization.
  • IT Opposition
    • Historically it was common for IT to wage turf wars over ownership of Spend Analysis projects. IT frequently opposed Spend Analysis initiatives because they had resources already dedicated to ERP, consolidating organizational data and providing management reporting. IT wants to centralize control of software applications and they considered Spend Analysis just one more application to manage, and a redundant one as well. They didn't understand its intrinsic value to the company, especially when it uses the same data found in other applications.
    • However, with a growing level of respect for the value of data cleansing and classification, attitudes are shifting -- especially when IT is not required to invest a large amount of man-hours to support the initiative. A common problem in the past was that spend data was misclassified, lacked sufficient detail or was stale (out of date). Also, the entire process took a great deal of time starting with getting the data ready for the cleansing/classification process. Most of the heavy-lifting efforts fell on IT. When inaccuracies were discovered in the dataset, the entire dataset was considered flawed which made the whole Spend Analysis initiative seem less reliable.
    • It has become much easier to support today's Spend Analysis applications, especially those that are SaaS (software as a service). IT would still be responsible for making the data available, but most of the heavy-lifting is now done by the Spend Analysis application, especially those with data-driven architecture. The Sourcing team bears the responsibility to give direction to cleansing/classification processes and highlight errors so they can be corrected. Refresh cycles are dramatically shorter (2-5 days vs. 2-4 weeks) so that spend data retains its "freshness."
    • IT personnel frequently have some key skills that contribute to the success of the initiative:
      • Familiarity with corporate data sets and applications.
      • In-depth knowledge and access to the Corporate IT environment.
      • Hi-level knowledge and experience with corporate reporting tools.
      • Experience establishing repeatable processes to export and distribute data.
What is Spend

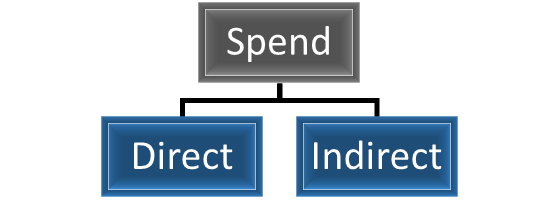
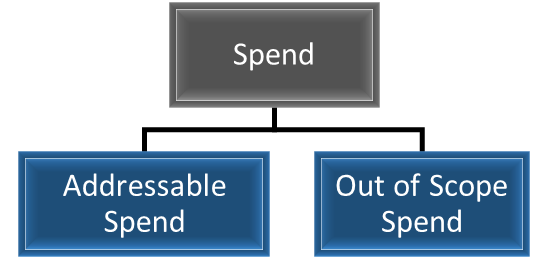
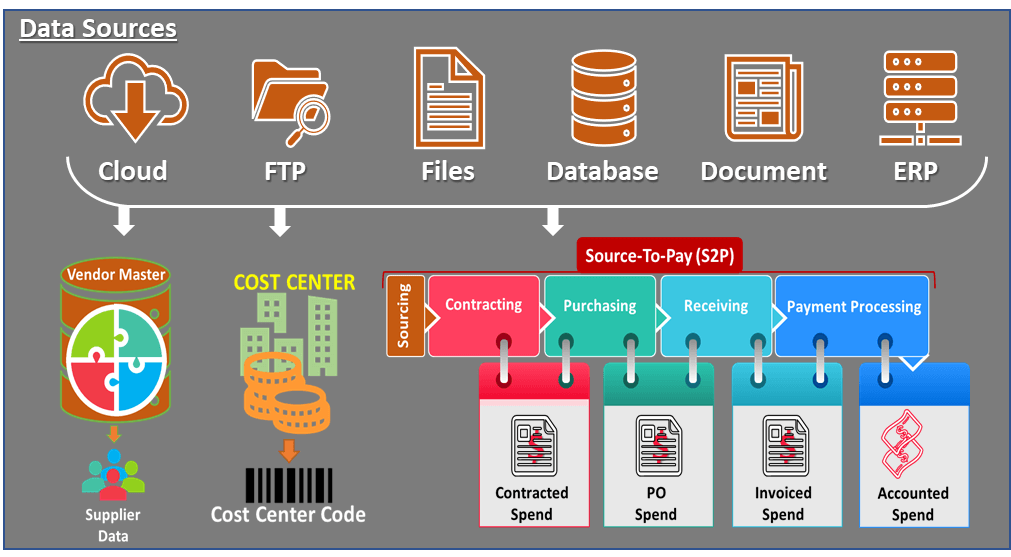
Spend represent the organization’s expense or expenditure on staff costs as well as the purchase of goods and services from external suppliers.

Types of Spend
Direct spend,Indirect spend
  • Direct Spend
    • In procurement, direct spend refers to the purchase of goods and services directly related to the production of goods and services of an organization. Examples may include raw materials, components, hardware and services related to manufacturing processes.
    • Making large quantity purchases in which costs have been pre-negotiated with specific suppliers
    • Typically frequent purchases that have been budgeted for
    • Direct spend costs are usually monitored very closely
  • Indirect Spend
    • Indirect Spend is the sourcing of goods and services that not directly related to manufacturing of products.
    • Purchase of goods and services needed for the day-to-day operation of a business such as office supplies, equipment repairs, consulting services, etc.
    • Costs associated with solid waste disposal, recycling, and environmental fees
    • Small quantity purchases with no advanced cost negotiation with suppliers
    • Purchases made as needed/when needed
    • Indirect spend purchases are rarely monitored
    • It is estimated that 20% to 50% of an organization's overall operating costs fall under the 'indirect spend' category. So reducing this spending can significantly improve a company's bottom line.
      Examples of indirect spend categories include:
      • marketing services (media buying, agency fees)
      • professional services (consultancies, advisors)
      • travel and lodging
      • MRO (maintenance, repair and operations)
      • information technology (hardware, software)
      • HR related services (recruitment, training)
      • Transportation and fleet management
      • Utilities (gas, electricity, water)
        Indirect spend,addressable spend
  • Addressable Spend
    This is the proportion of expenditure that is eligible for spend savings i.e. the proportion of the cost of a purchase or service that can be reduced by re-letting a contract
    • Managed Spend : Any demand for goods and services that management wants directed toward preferred suppliers is considered managed spend.
    • Non-Managed Spend : Spend without an approved source of supply and buying process was not followed
    • Delegated Spend : Spend though within scope of organization, but delegated to business or function to manage.
  • Out of Scope Spend
    • Spend that will remain under management of business unit or spend not considered addressable.
      Managed spend, out of spend
    • Select Supplier Spend : Spend under agreement with a select supplier per global sourcing and purchasing policy
    • Non-Select Supplier Spend : Spend under agreement but agreement did not meet requirements of select supplier
    • Spend not under Agreement : Buying where a pre-designed source of supply did not exist
Spend attributes (“W” of Spend)
Spend dimension,spend attributes
Steps of Spend Analysis Process
Spend process,7 steps of spend process
(7 Process steps of Spend Analysis)
  • Identify (Data Extraction)
    • The first step of spend analysis start with Identifing and extracting spend data from internal and external data sources, from all departments, plants and business units
    • Multiple data sources of Spend data are “payments in AP”, “items in PO”, “PCard expenditures”, “expenses”, “financial data”, and “purchase from different suppliers”.
    • Data source or storage location of operational data is Data Cloud, ERP, Datawarehouse, flat files etc. Extracting data or data extraction is the initial step in a data ingestion process called ETL (extract, transform, and load). There are 2 types of data extraction methods:
      • Logical Extraction:. It is the starting point, mostly involved, required a visual integration flow, helps data professionals to create a physical data extraction plan. It is of 2 types:
        • Full Extraction : Data copied from the source system entirety, even if in some changes without any timestamp.
        • Incremental Extraction : Data is extracted in increments with this approach. New or change data can be track with timestamp.
      • Physical Extraction Extract data directly or physically from the source system as per logical integration flow. It is of 2 types:
        • Online Extraction : Data is extracted directly from the Source system for processing in the staging area
        • Offline Extraction : Without extracting data directly from the source, it’s taken from another external area (can be Flat files, or some dump files in a specific format ) which keeps the copy of source.
          Spend data sources
  • Gather (Data Consolidation)
    • The next step is to consolidate all different sources data into one transaction template and stored into a central database. It’s a very challenging task as :
      • This data comes from different data sources with different formats, languages & currencies.
      • Data may not have all the required columns.
      • Data has more columns than required.
      • Data types of columns may not match across datasets.
      • Columns may not be in the same order across datasets.
    • Procurement leaders prefer to use “Hand coding” by data engineers just for small dataset from couple of data sources or by a market leader “ETL Tools” for efficient, speedy and large dataset from most of data sources.
    • In both scenario, data tables of multiple data sources inter-linked or relate each other with a schema, which can help to standardize and fixed meta data challenges.
      Spend data consolidation,spend schema
  • Cleanse (Data Cleansing)
    • Once data consolidated from multiple data sources into a single storage database, it is very important to detect inaccuracies and removing corrupt records and redundancies from the dataset.
    • Data cleansing is the process to find and eliminate errors and discrepancies in descriptions and transactions to ensure a good and clean accurate data.
    • Data cleansing is the most important and mandatory steps of data transformation, that improves the data quality and increases overall productivity. It is based on :
      • Processing, defining, and correcting jumbled, unstructured data
      • Filling in missing values, finding and removing errors
      • Detecting, fixing and rectifying (or deleting) of irrelevant, inaccurate, corrupted, incorrectly formatted, duplicate, or incomplete data within a dataset
    • It helps on quality checks like :
      • What’s the total amount
      • Whether all suppliers are included
      • Identifying duplicate suppliers
      • Normalizing prices to exchange rates etc.
    • The aim of the step is to produce a clean data file that helps to group / cluster un-enriched spend attributes accurately and reliably that reflects the entire company spend.
      Data normalization,data clustering
      Data normalization,data clustering
  • Cluster (Data Clustering)
    As organization transactional data is collected and consolidated from multiple data sources, there is a possibility of purchase from same supplier with a different name having multiple spellings, mis-spellings, abbreviations e.g., same supplier spelled as “Federal Xpress” or “FedEx” and “Federal Express. Also, there is a possibility of same supplier with different name as per location, company entity, or suffixes like “IBM India Pvt Ltd”, “IBM Japan Ltd”, “International Business Machine”. To ensure data consistency, organization come up with a technique called “data clustering”, “Supplier clustering” or “Supplier Normalization”. The benefits are:
    • Create grouping /clustering /Parent -child linkage suppliers for better supplier management.
    • Helps customer groups based on the purchasing patterns
    • Helps to create reports, insights and then analyze the true consolidated spend.
    • Achieving the greatest volume of savings potential or saving opportunity.
    • Managing the number of suppliers for Pareto analysis.
  • Categorize (Data Classification)
    Categorization or Data classification is the technique that helps to the business by categorize or classify the data into different buckets of information along with a consolidated spend. In other words, Data Classification is the process of grouping spend data for similar goods or services and assigning them to a predefined categories using a document called Taxonomy. It enables procurement leaders to have a fair understanding or visibility to the global spending in order to make better sourcing decisions.
    • It is the main steps of data enrichment by grouping Item, Suppler & GL and assigning to a specific category for better supplier management.
    • The spend classification or categorization process in diagrammatically represented in the later portion of the knowledgebase.
    • Although both Classification and Clustering are used for data enrichment & categorization of spend attributes, both are differ in following ways:
      Data normalization,data classification
      Data normalization,data classification
  • Analyze (Data Insight)
    Once transactional data is extracted, cleansed, enriched and classified, procurement leaders try to analyze to identify opportunities for savings and other procurement improvements. For example, to validate negotiation of contract per supplier, procurement buyers need to analyze that all purchasing be happens from preferred suppliers. So that it leverage cost savings opportunities with respect to reducing the number of suppliers per category with better negotiation. The different types of spend insights, KPI & reports are described at the end of the knowledgebase.
    Spend analysis dashboard, Opportunity Assessment
  • Repeat (Data Refresh)
    Spend analysis is an ongoing process to check how the process makes better with more cost saving opportunities and get more benefits. For that procurement team performs a continuous repetitive spend analysis once there is a good start. Also due to additional new or updated transactional data extracted from data sources, the same process again starts from the first step. The repetition might be additional data append or a full data extraction.
    Spend analysis process,spend data enrichment
Taxonomy

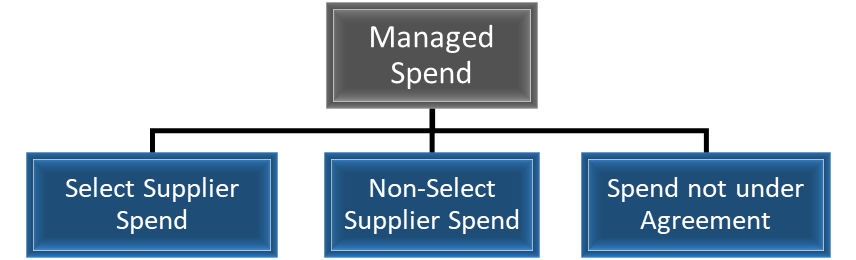
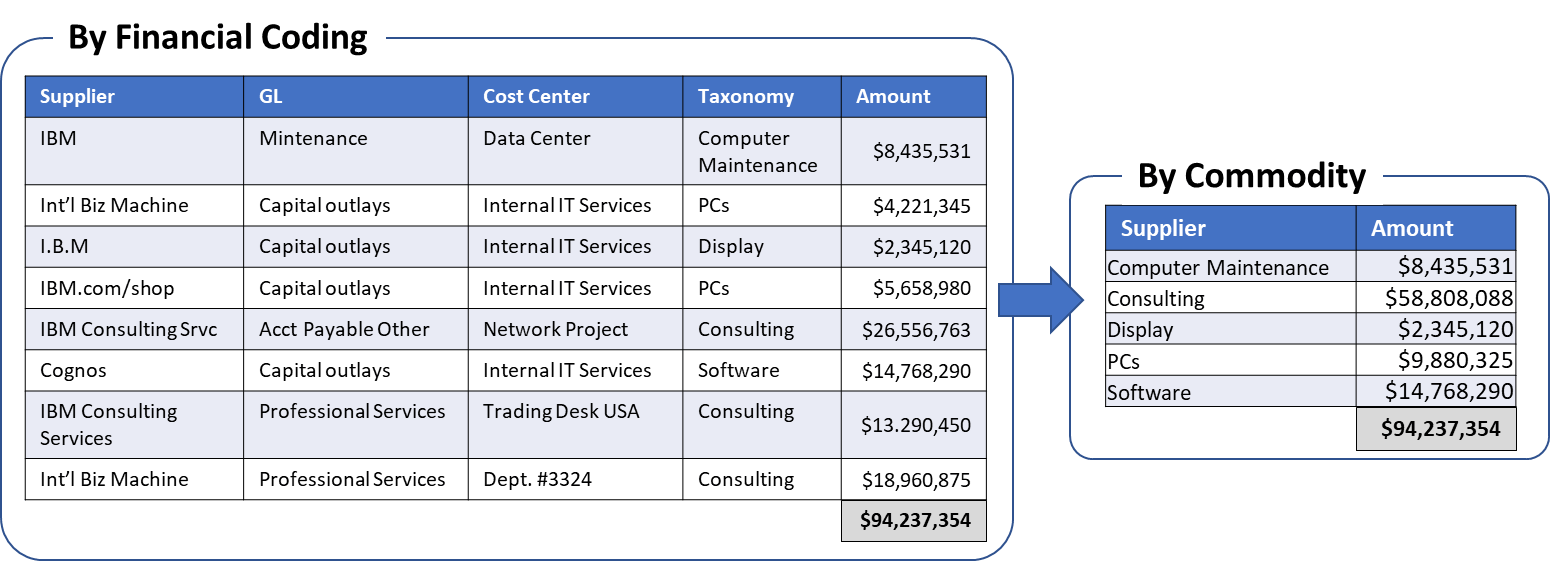
A spend category is the logical grouping of similar expenditure items or services that have been clearly defined on an organizational level. For example, “information technology” may be considered a spend category covering both IT software and hardware.

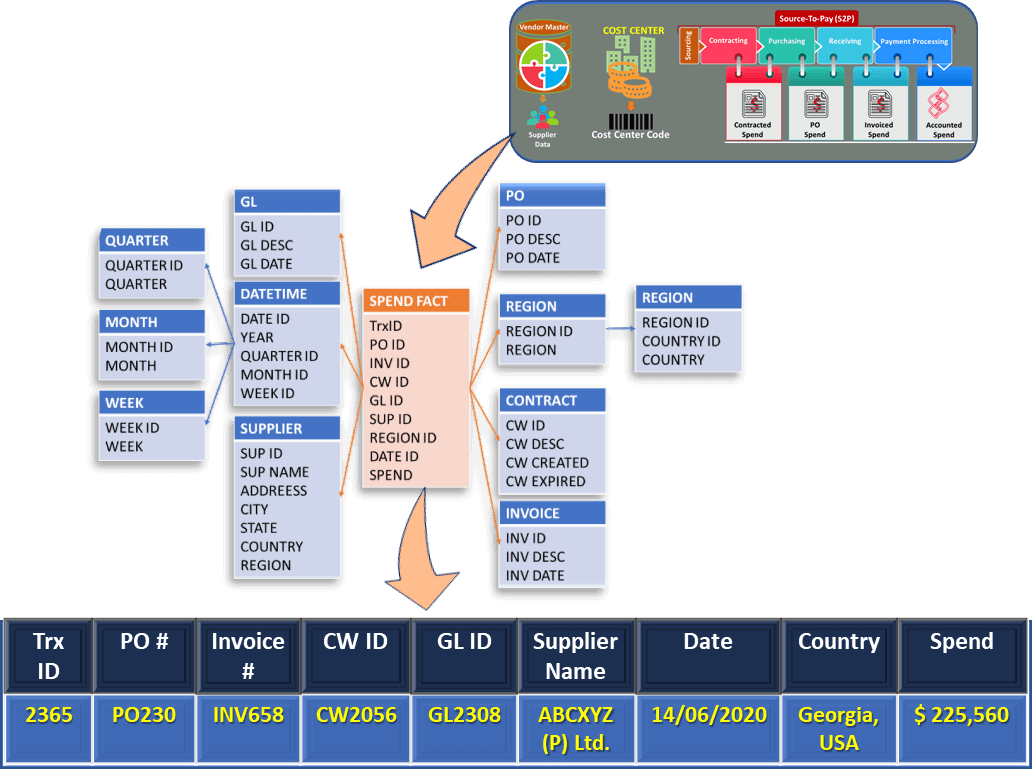
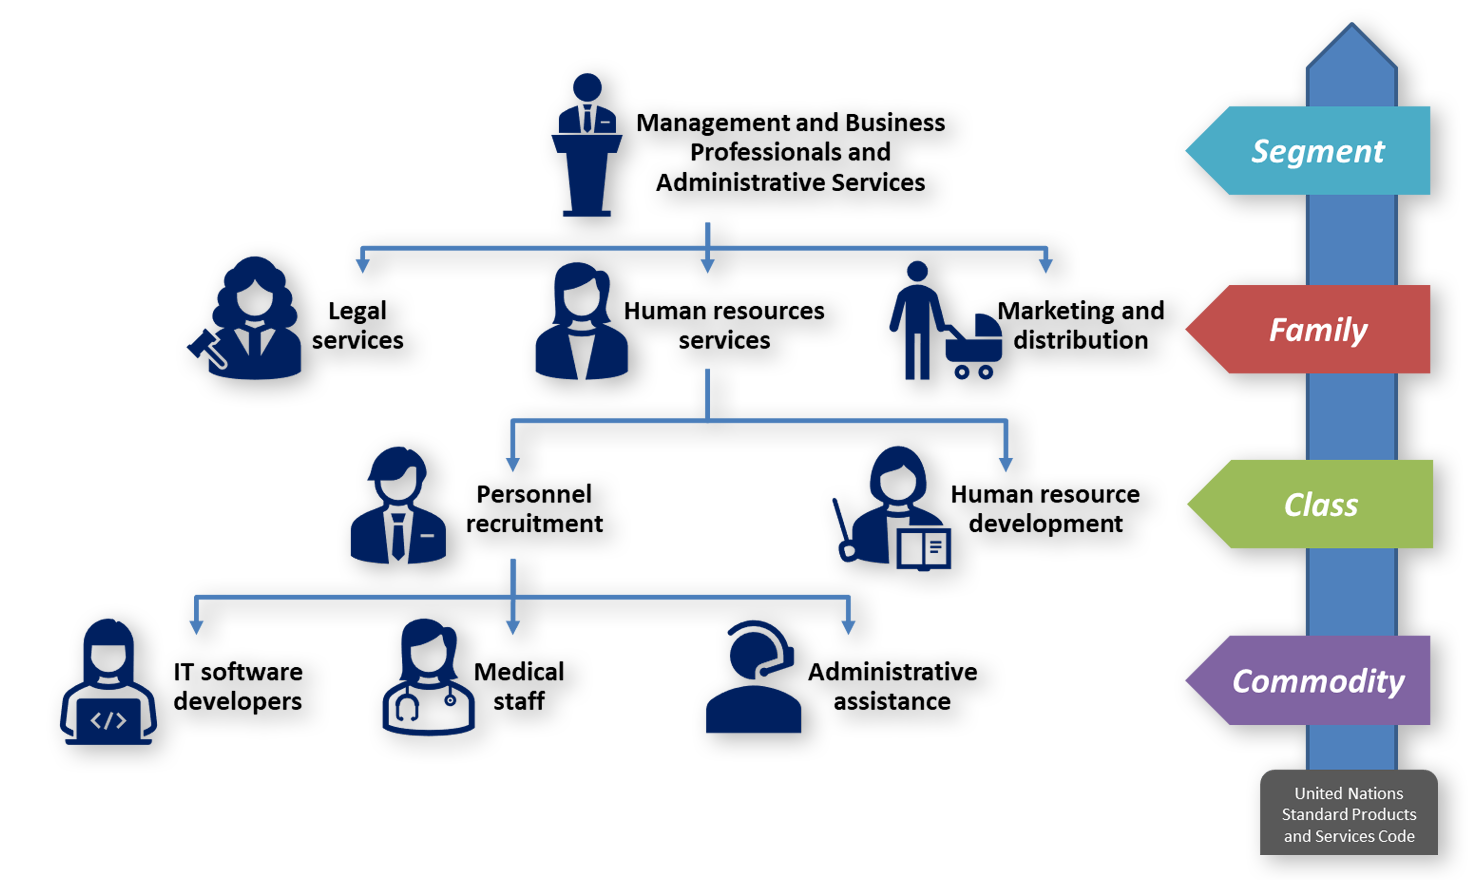
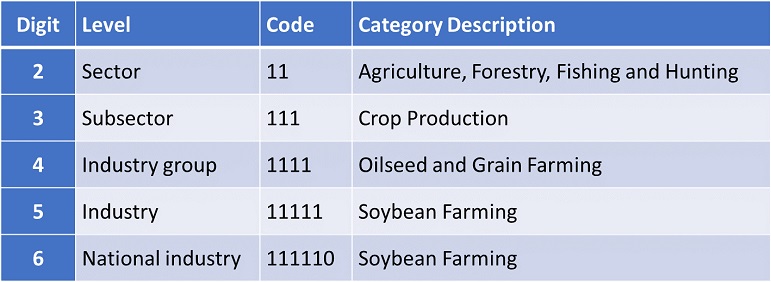
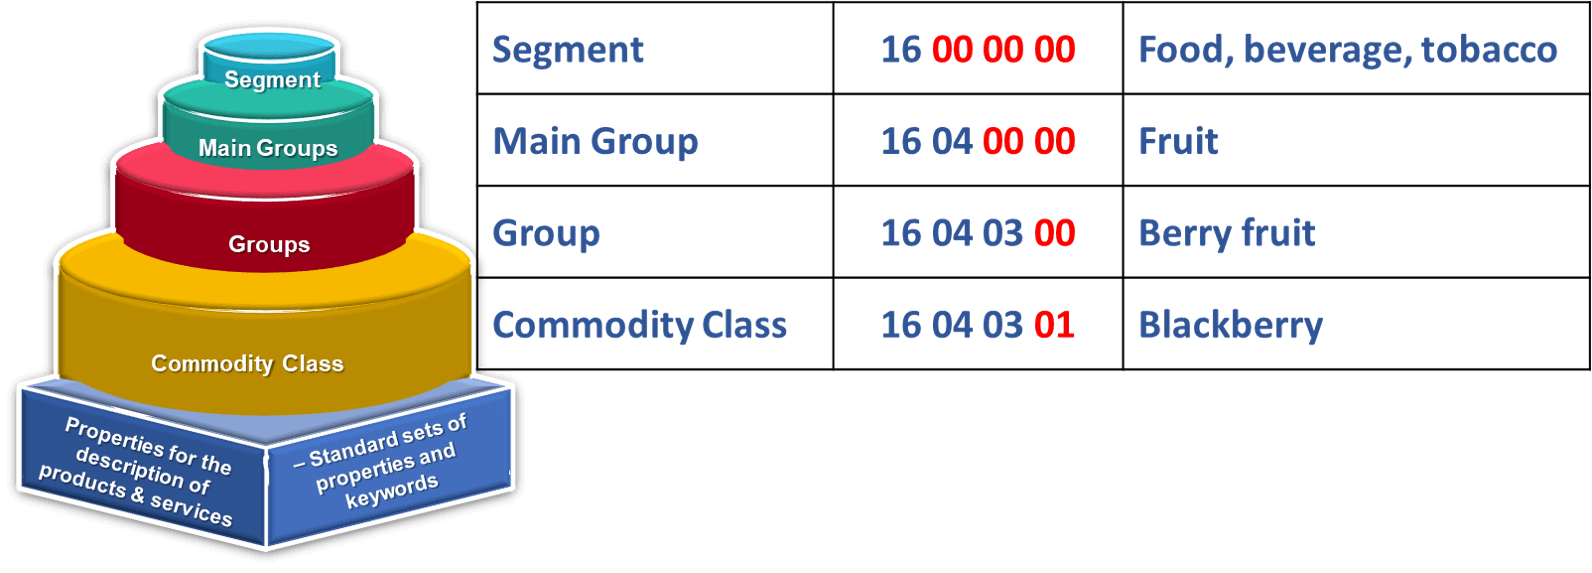
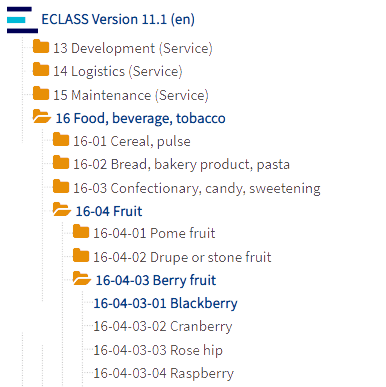
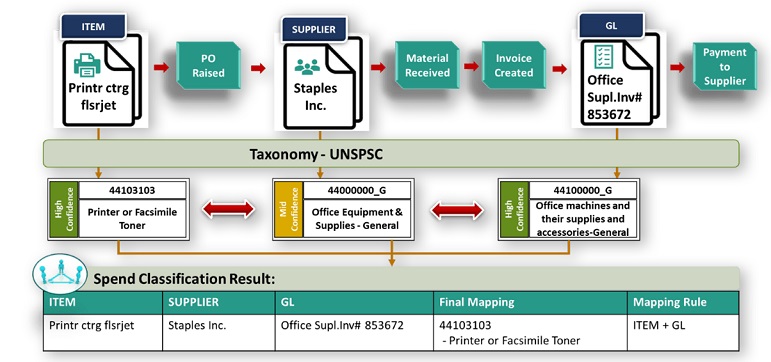
Spend taxonomy is the way a procurement organization classifies spend into hierarchies. So spend categories is like a tree with many branches for different levels or sub-categories of spend. The number of levels in a spend taxonomy depends on the organization’s needs and complexity of the spend, ranging from three to five levels of categories and sub-categories . Spend taxonomy can be standard one like UNSPSC, NAICS, SIC, ECLASS or custom one as per organization purchased categories.

  • UNSPSC - United Nations Standard Products and Services Code
    • It is managed by US for the UN Development Programme (UNDP) which is an open, global, multi-sector standard for efficient, accurate classification of products and services. It can be used for cost-effective procurement optimization & company-wide visibility of item by item spend analysis
    • Hierarchy : Segment ← Family ← Class ← Commodity
      Unspsc,taxonomy,United Nations Standard Products and Services Code
    • Although UNSPSC classifications are highly valuable within materials management procurement organizations, but in reality most organizations do not source based upon UNSPSC, due to:
      • difficulty in obtaining classifications across most items
      • the “buckets” of items are often not similar in nature.
  • SIC - Standard Industrial Classification
    • It is established by United States in 1937 and is used by government agencies to classify industry areas with a four-digit code.
    • SIC codes have a hierarchical, top-down structure. The first two digits of the code represent the major industry sector to which a business belongs. The third and fourth digits describe the sub-classification of the business group and specialization, respectively.
      36 →Electronic and Other Equipment
      367 →Electronic, Component and Accessories
      3672 →Printed Circuit Boards
    • SIC is well established and has been utilized for many strategic sourcing projects; however, SIC code has been replaced by the North American Industry Classification System (NAICS code) in 1997.
  • NAICS - North American Industry Classification System
    • In 1997, NAICS is developed in cooperation with Canada, Mexico and United States of America.
    • It is become the predominate standard for strategic sourcing (apart from custom taxonomies), as NAICS provides a grouping that is most similar to how procurement teams research in industries and source commodities.
    • It has largely replaced the older Standard Industrial Classification (SIC) system.
    • It have five or six-digit code to classify at the most detailed industry level where the first two digits represent to largest business sector, the third digit represent to subsector, the fourth digit represent to industry group, the fifth digit represent to NAICS industries, and the sixth digit represent to national industries.
      NAICS,taxonomy,North American Industry Classification System
  • ECLASS - North American Industry Classification System
    • ECLASS (formerly styled as eCl@ss) is a classification system for products and services. It is maintained by the industry consortium ECLASS e.V. association
    • Like UNSPSC, it consists of a four-level hierarchy of classification as
      Hierarchy: Segment ←Main group ← Group ← Sub-group or commodity class (product group)
    • The hierarchy of the classification consists of an 8-digit integer number i.e. two digits for each hierarchical level. The number of trailing zeros in the end indicates the level of hierarchy, e.g.
      Eclass,taxonomy

      eClass,eClass hierarchy
    • The fourth level, the commodity class or product group is then further described with the help of properties and property values which form the basis for the product description
Spend Categorization Process:
Spend category process,Spend classification,triangulation classification
Types of Spend Analysis :
Spend analysis types,tail spend analysis,vendor spend analysis,category spend analysis,item spend analysis,payment term spend analysis,contract spend analysis
Spend Analysis KPIs

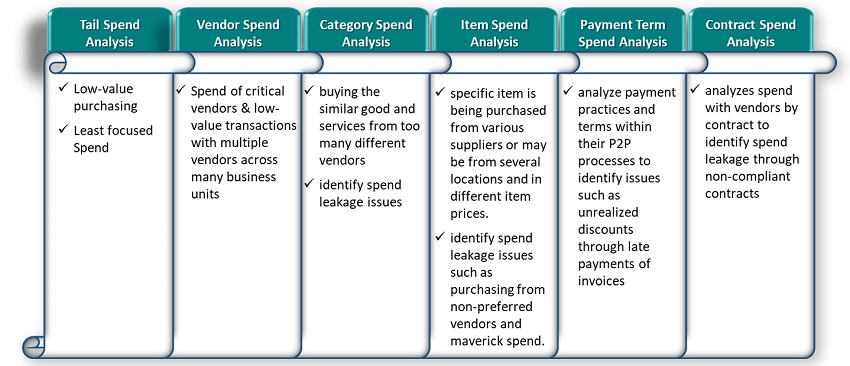
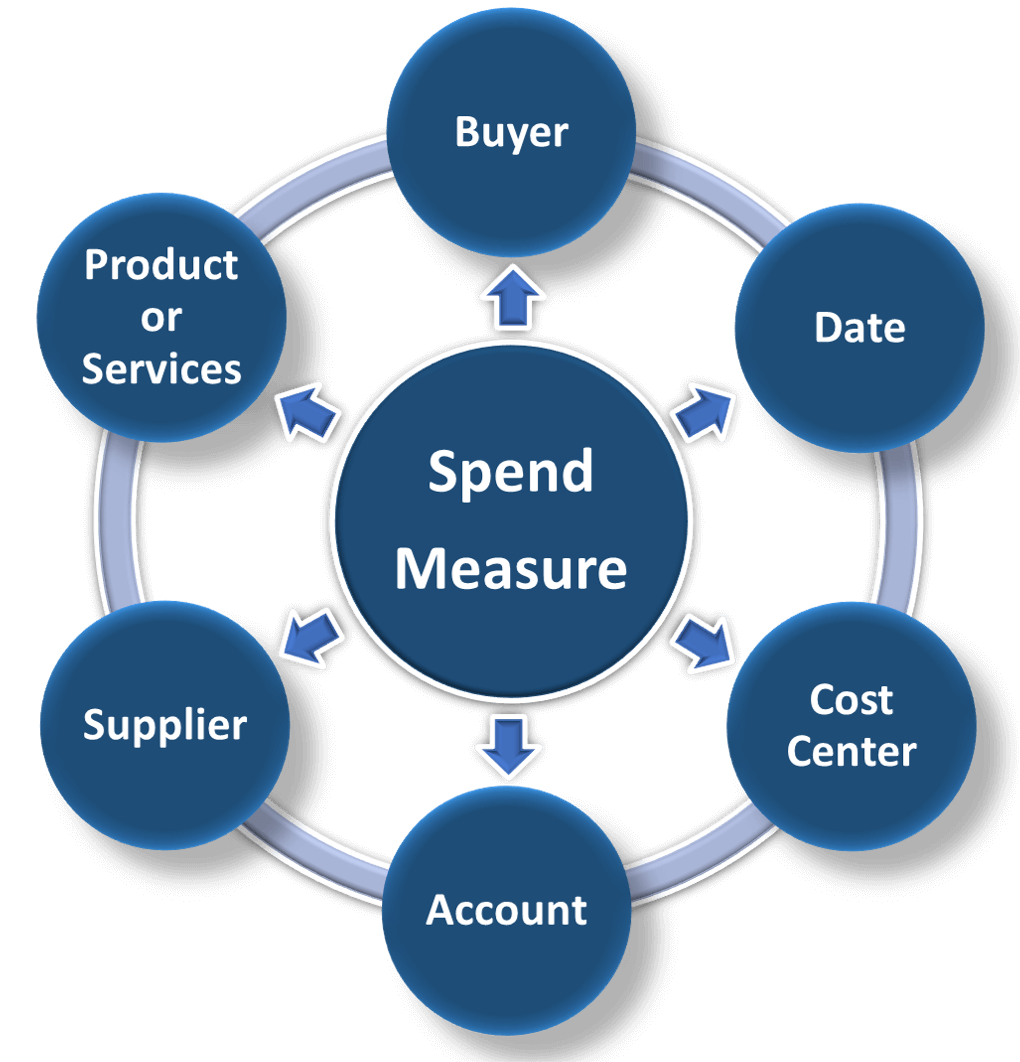
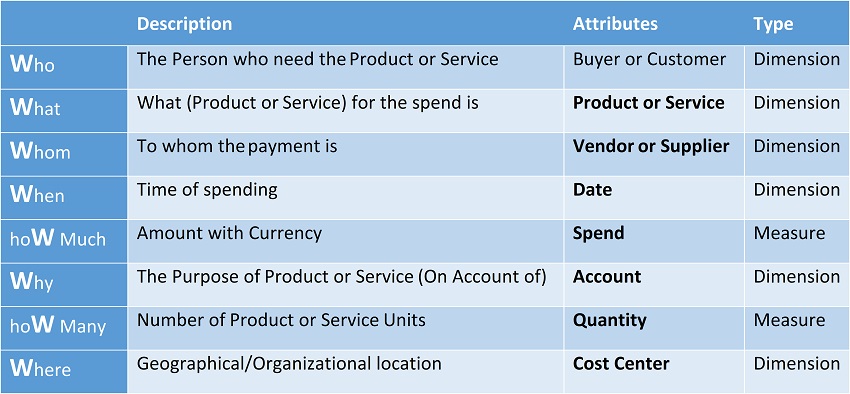
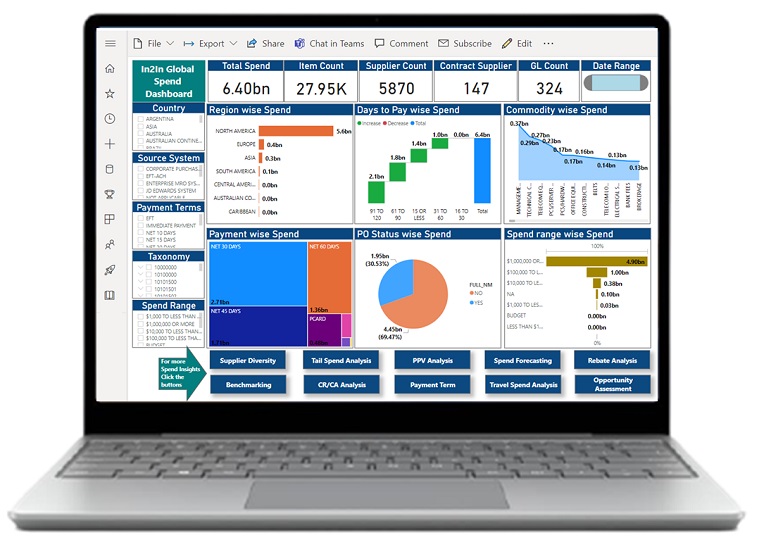
Procurement data can be sliced and diced based on a number of key performance indicators (KPIs) relevant to the procurement organization. Some of the most common spend analysis metrics or KPIs include:

  • Sourcing Opportunity analysis
  • Category Trend analysis
  • Category Opportunity analysis
  • Approved/Preferred supplier spend
  • PO vs. non-PO spend
  • Purchase price variance analysis
  • Payment Method and Terms
  • Maverick Spend analysis
  • Contract compliance analysis
  • Risk Categories suppliers analysis
  • Best Performing Suppliers
  • Supplier Diversity Analysis
Spend Analysis Reports

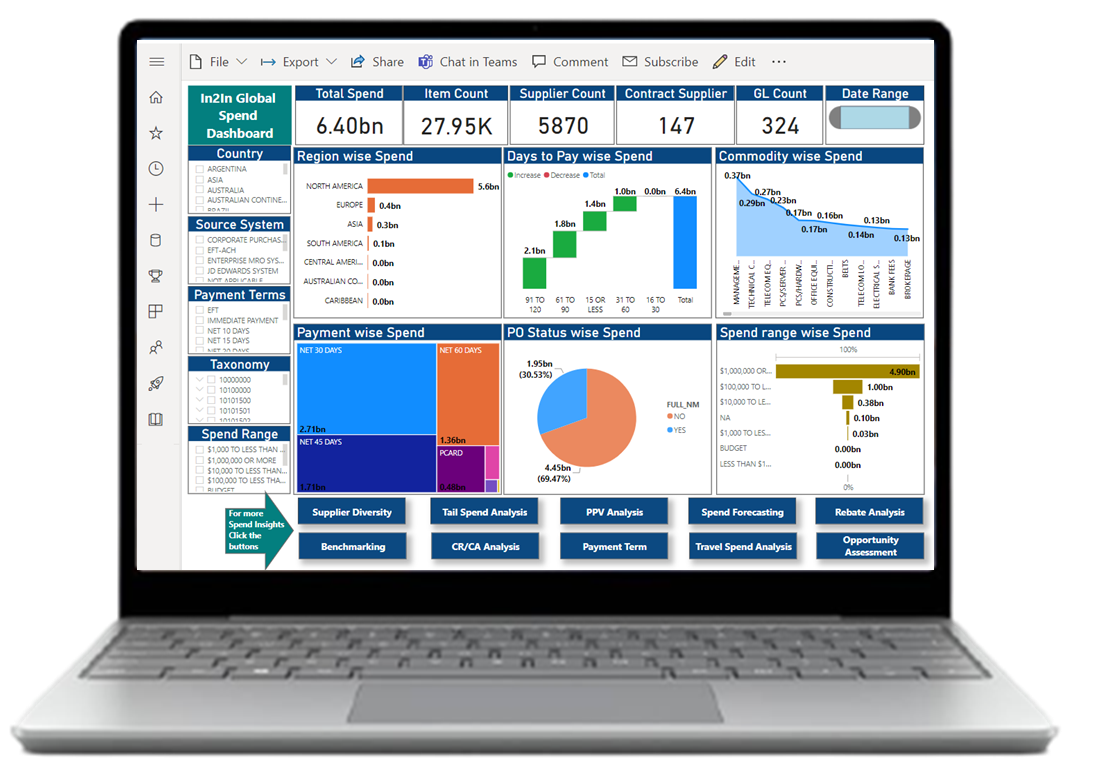
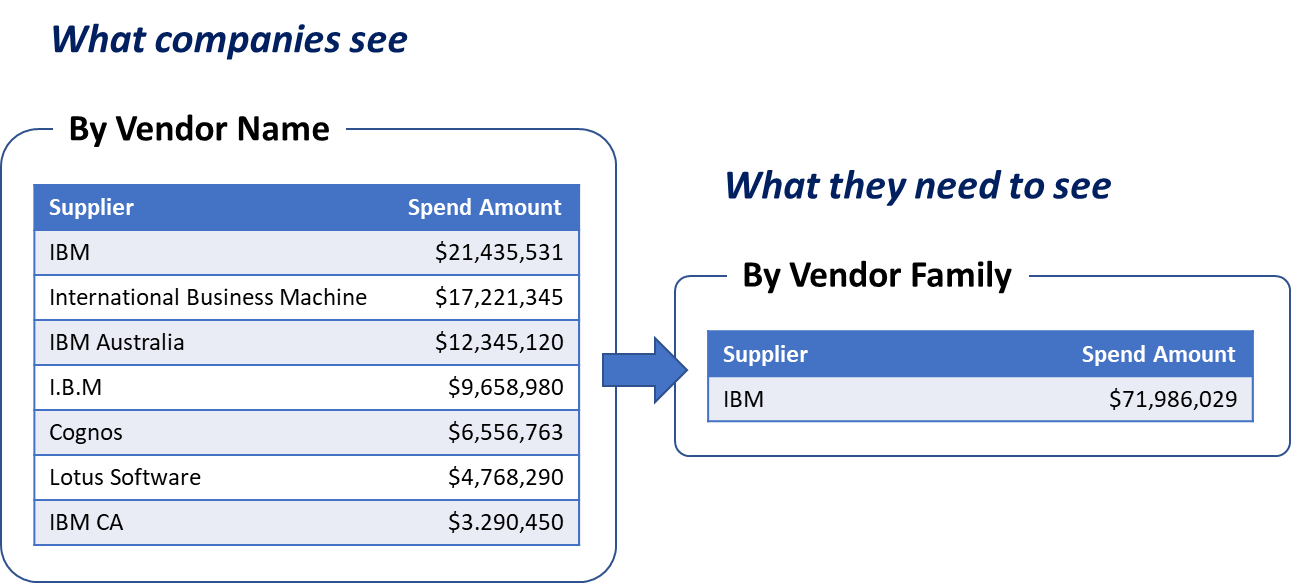
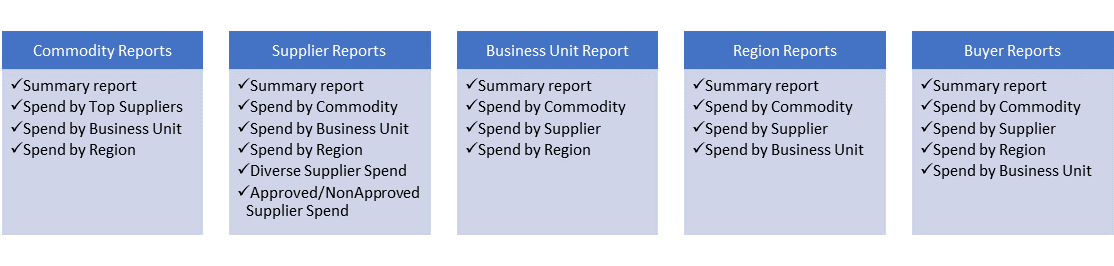
Procurement leaders are keen to see effective spend reports and analytics for better business decisions and cost saving opportunities. Some of summary and top spend reports on highly effective spend attributes like:

Spend report,commodity report,supplier report,Business unit report,Region report,Buyer report
Conclusion

Analyzing organizational spend is easier said than done. It have a great capability for identifying and implementing cost reduction activities based on the analysis. Both technology and consulting plays a major role in the implementation of procurement spend solution, where it leverages to streamline the spend management process and assess the spend activity thoroughly with respective changes as needed. This will allow organization to manage the risks, ensure compliance, and maximizethe optimum profits.

In2In Globaldata transformation and Insights solution lets you gain full spend visibility and manage your company’s sourcing activities. Our highly experienced Spend Analysis data experts& SMEs make your life a bit easier by gathering your spend challenges and willprovide cost-effective pricing plans for our both online & offline procurement spend data transformation and management system. Get in touch with us to know more in details and give us an opportunity to serve you better.

Thank you for your valuable time to read the knowledgebase on spend analysis.

Give us an opportunity to serve you better

Let's talk about your data transformation and insights issues. Our highly skilled data analysts will look at your data challenges and offer cost-effective price plans on both automated platform & consulting approach. We'll show you how our solutions mitigate risk, guarantee compliance and optimize revenues from your transactional data.